03Sense
Plant digitalisation
& AI platform
Factory Intelligence
From points to surfaces to 3D.
Site data as the foundation for AI.
IoT installed for control doubles as the plant’s sensor network.
See the site through
space and time
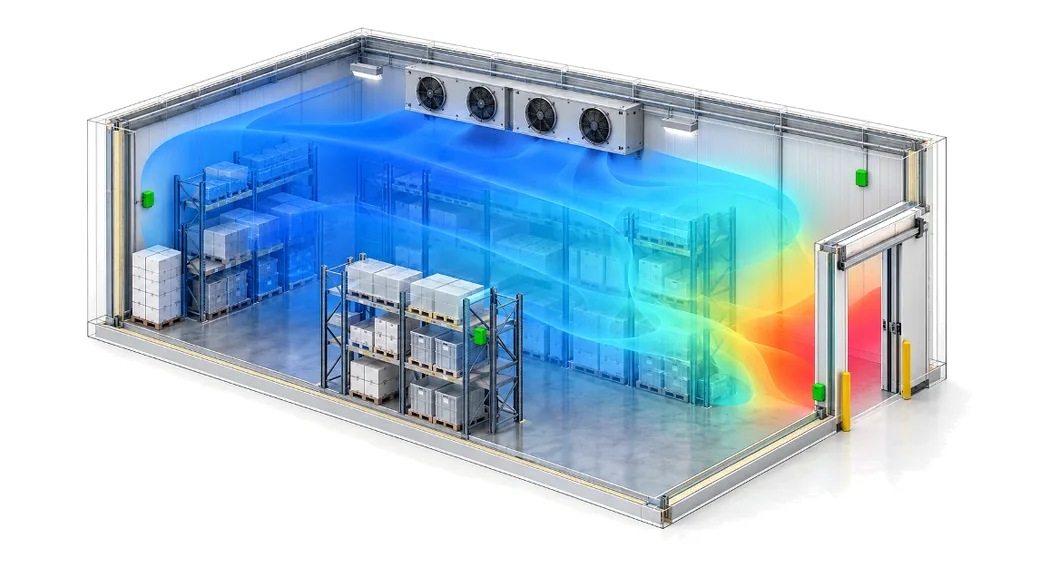
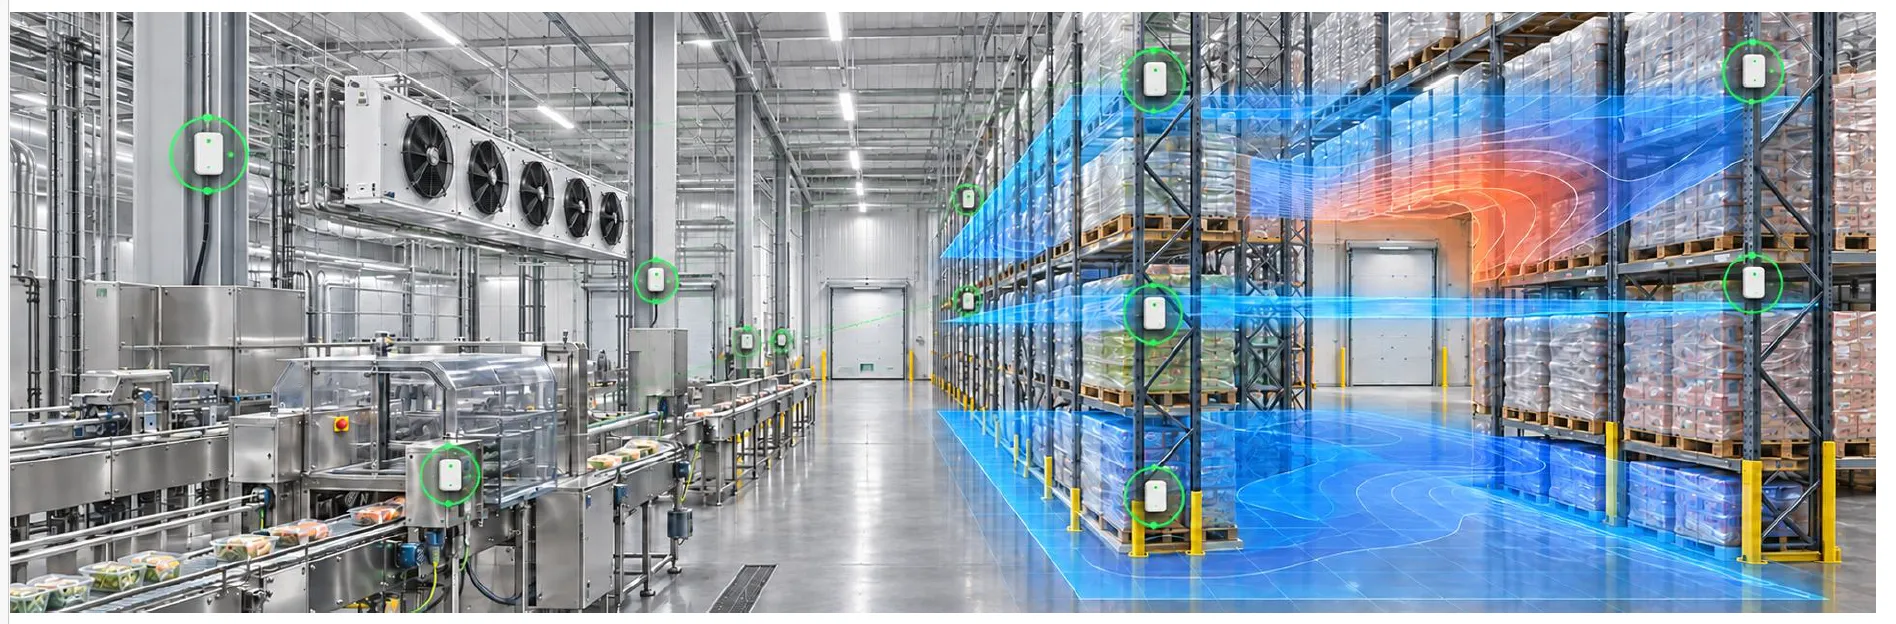
Greenphard’s control IoT doubles as the plant’s sensor network. Temperature, humidity, current, power and operating status are visualised, integrated and structured. 2D and 3D temperature maps and time series reveal what is happening on site.
01 Sensor network
Green circles = sensor locations
02 Temperature map (2D)
Uneven temperatures within the room
03 Temperature map (3D)
Sensors at several heights
04 As a time series
Current (per unit) / Room temperature (band = permitted band)


Greenphard AI + Generative AI
Beyond control by our own AI: a foundation for using generative AI on the shop floor.
Joint offering in preparation
Planned jointly with consulting firms and systems integrators. Timing and scope are being finalised.
Greenphard
customer case studies
Food plant
Digital monitoring of fermentation
Current, power, temperature and operating status are visualised. Temperature management is helping reduce product waste.
Indoor vegetable farm
Temperatures adjust to the growth stage
Temperatures on each production line are adjusted to raise productivity while advancing energy saving and demand response.
For strategy, digitalisation
and AI teams
Talk to us about plant digitalisation and AI. Select “Visibility & AI Platform” as your enquiry type.
Discuss Digitalisation & AI* AIP means digitalisation & AI platform. Data items, granularity, retention and delivery format depend on the function grade. Data is shared with third parties only with your consent.
* Plant images and waveforms illustrate the visualisation concept. The two cases are Greenphard customer projects. Images are not of those facilities, and waveforms are not measured data.
* 3D temperature mapping requires multiple sensors.
* Data items, granularity, retention and delivery format depend on the function grade. HVAC systems in buildings, commercial facilities and offices are offered the energy saving & DR grade only. Demand response requires a separate DR contract and is not included in the function grades. Data is shared with third parties only with your consent.