04Select
Power Supply (Agent)
Greenphard Energy Supply
Change how you use power,
and how you buy it changes.
A best mix of electricity retailers, enabled by IoT and Physical AI control.
Two key features
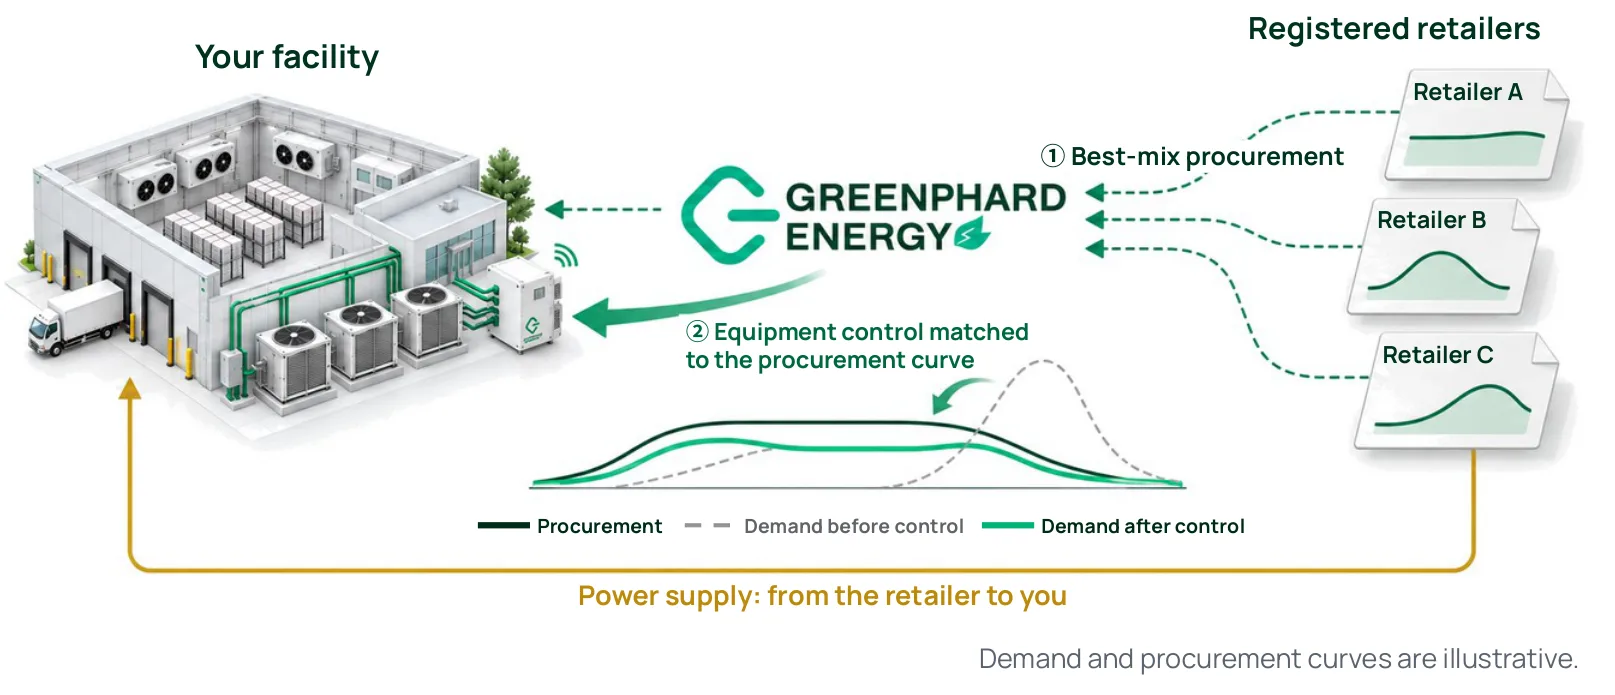
① The best mix of retailers, based on a deep understanding of your demand.
Greenphard acts as an agent to propose the best mix of suitable electricity retailers, matched to each site’s usage pattern.
② A special plan for further savings by shaping demand to the procurement curve.
Controlling demand-side equipment lowers retailers’ procurement costs. Our technology matches demand to the power market, enabling a special power supply plan (including concepts under development).

Match demand
and procurement.
Lower power costs.
Retail electricity is supplied by registered electricity retailers, with Greenphard Energy acting as an agent. We match each site’s demand with retailers’ procurement profiles and adjust equipment operating times to help reduce electricity costs.

Electricity is supplied by registered retailers
We act as an agent. Your supplier is identified in your contract.
Changing retailers does not change supply reliability
Outage frequency and restoration speed remain the grid operator’s responsibility.
The best mix of retailers for your needs and conditions
Supply coordinated across multiple registered electricity retailers
How we build
the best mix
Every site has a different demand curve, and every retailer a different procurement profile. We select compatible combinations to help lower costs. Top: your demand curve (illustrative 30-minute values). Bottom: the corresponding procurement profile.

Cold storage
Nearly flat all day

Flat all dayMainly baseload


Food plant
Midday-heavy

Midday-heavyMainly solar


Retail & stores
Evening-heavy

Evening-heavyMainly thermal & bilateral

Shift when you use power.
Lower procurement costs.
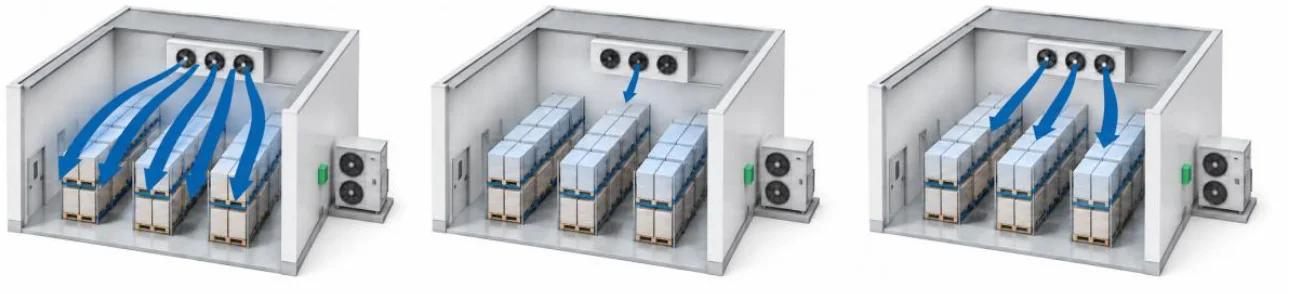
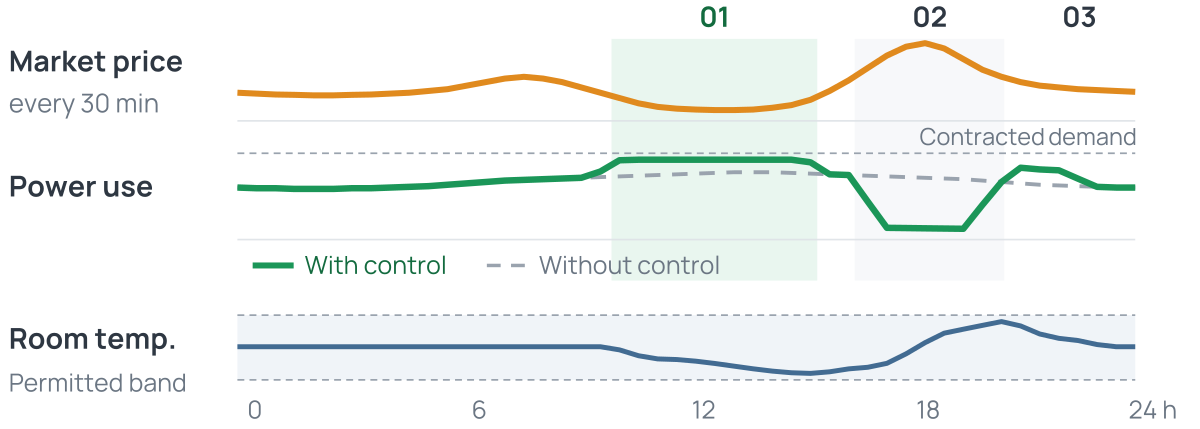
Combine how you buy power with how your equipment uses it. Refrigeration, cold storage and HVAC can shift demand to cheaper hours through automatic control within the set temperature band.
01 Cool when cheap
Increase cooling02 Coast when high
Reduce cooling03 Return as prices fall
Resume cooling
Three ways
to price your power
Fixed
Fixed unit rate
Hybrid
Partly fixed, partly market-linked
Market-linked
Varies with market prices; price movements are reflected in your bill.
* Retail electricity is supplied by registered retailers, with Greenphard acting as an agent. The supplier and price breakdown are identified in your contract. Partnerships with multiple companies are in progress (September 2026). A site can also be designed to receive split supply from several retailers.
* Special plans and price-linked control include concepts under development. Fixed items and adjustments depend on the contract. Market price movements are reflected in market-linked bills. Results vary with conditions and savings are not guaranteed. Diagrams are schematic.
* Holding back demand at the same time every day lowers the DR baseline, so the allocation between price-spread savings and DR is decided day by day.