01Save
Energy-saving
control
Use less power within the permitted temperature band.
Up to 40%*
* A 4-day comparison under stronger control in the same cold room (a 7-day comparison gave −32.3%).
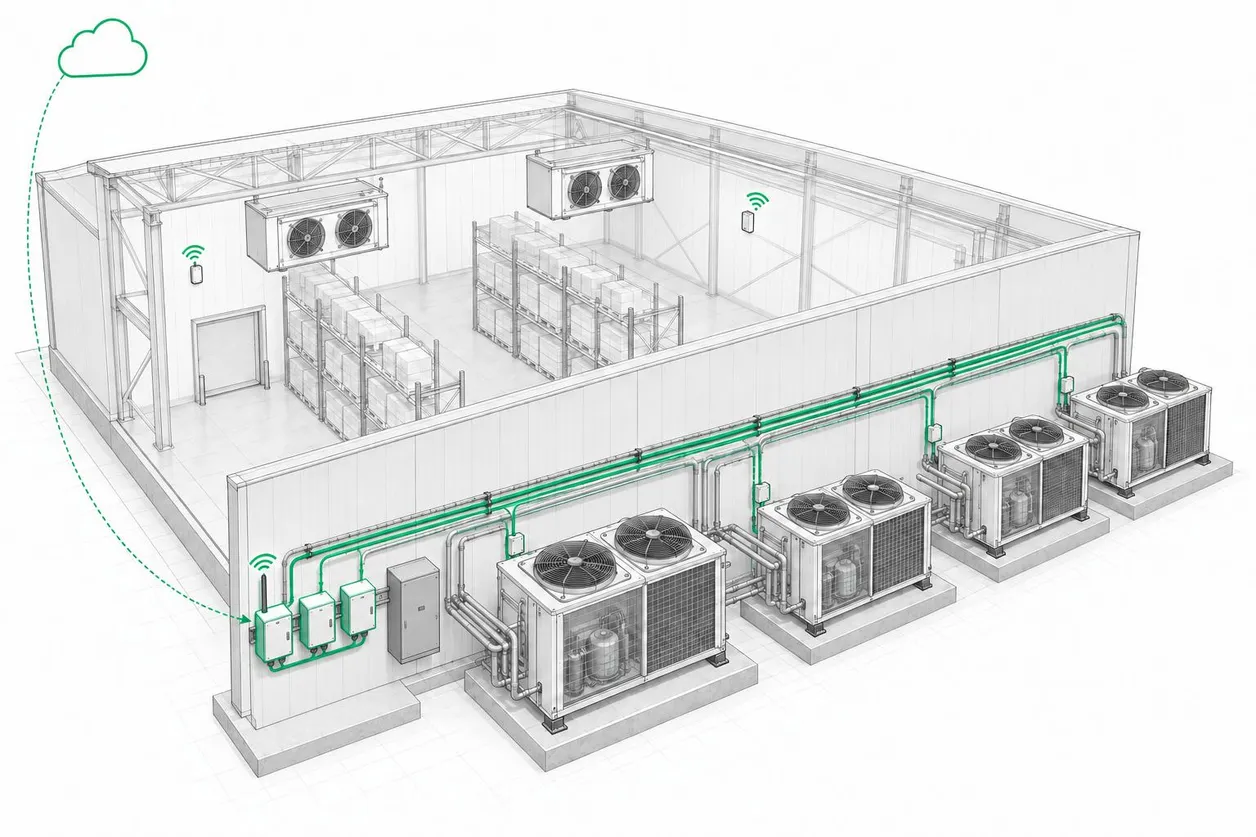



 Control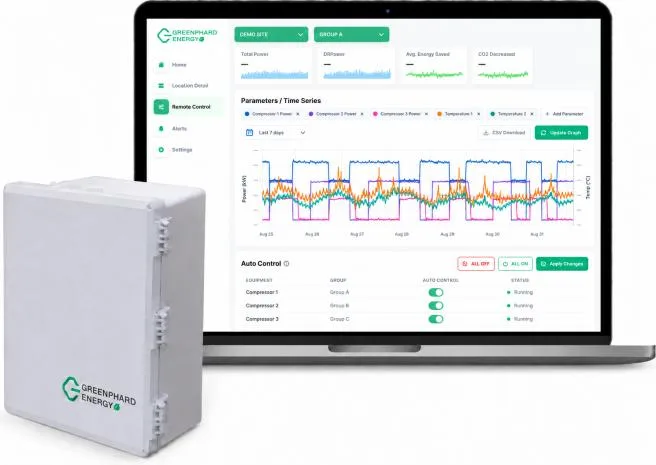
Two kinds of control.
Less wasted operation.
Advanced eco-drive control adjusts frequency, start/stop, staging and timing. Data-driven control reads temperature, power and outdoor temperature to identify wasted operation, then optimises it within the permitted temperature band.
01 Eco-drive control
Gentler on the accelerator, automatically.
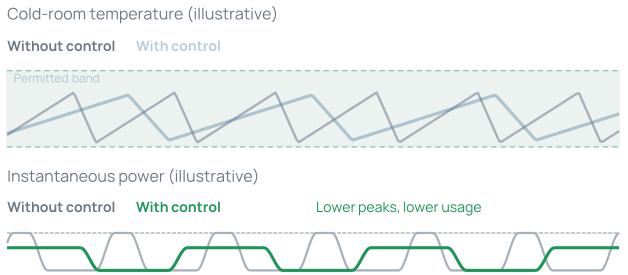
Compressor frequency, start/stop, staging and timing are adjusted to smooth temperature swings within the permitted band. Avoiding abrupt changes in operation saves energy.
02 Data-driven control
The data finds the waste.
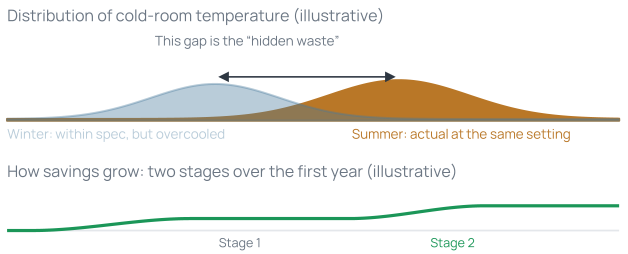
Temperature, power and outdoor data are compared by season and time of day. Overcooling and indoor–outdoor unit imbalances are identified and fed back into control to save energy.

Measured results
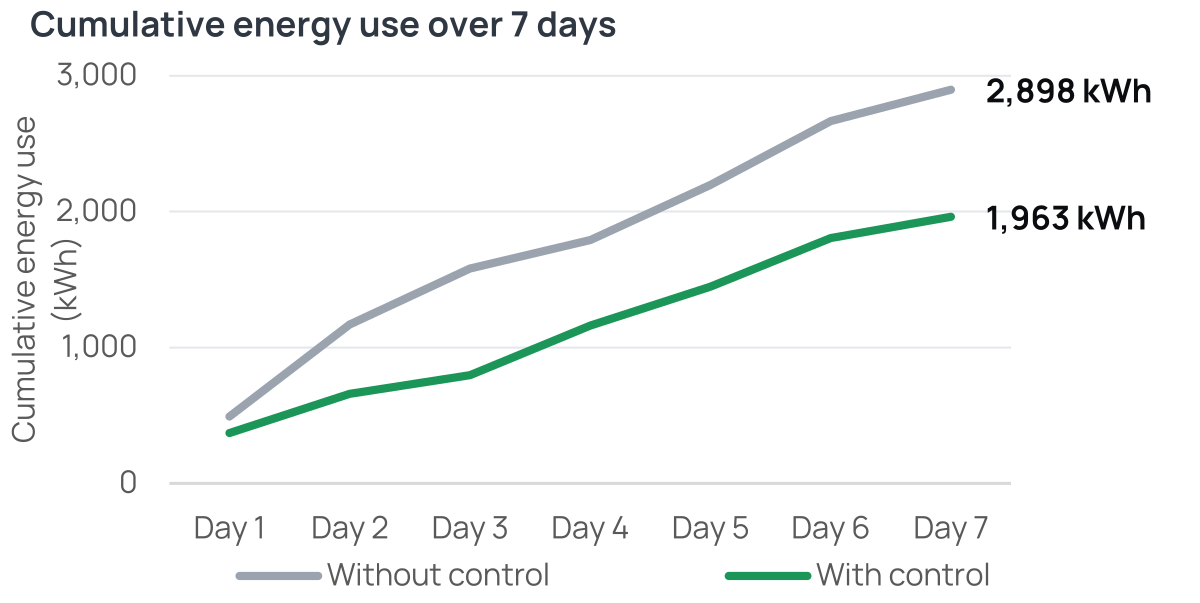
935 kWh saved in 7 days.
A 32.3% reduction.
- 2,898
- kWh | without control
- 1,963
- kWh | with control
- −32.3%
- Reduction in electricity use
At the same site (the cold room used for the −40% case), control was switched on and off every 24 hours and 7 days of each summed and compared (June 2026, 4 refrigeration units). Cumulative use and reduction rates are equipment-side measurements, not whole-site utility-meter values (1–15 June 2026, set point 5°C, management limit 8°C).
Measured results
at customer sites
Customer names withheld
−18.7%
HVAC
Major electronics manufacturer
Spring 2026; alternated with normal operation for comparison
−11.8%
Refrigeration unit
Major food manufacturer
Four measured periods regressed on outdoor temperature, annualised
−40%
Cold storage
Major vegetable producer’s cold room
4-day comparison under stronger control. A 7-day comparison in the same room, switching control every 24 hours, gave −32.3%.
Less electricity.
Less CO₂.
Energy saving lowers power bills and advances decarbonisation at the same time.
- ~147
- t-CO₂/year
- Cold storage 1 (large)
- ~83
- t-CO₂/year
- Cold storage 2 (medium)
- ~31
- t-CO₂/year
- HVAC: healthcare & nursing care
* CO₂ estimates use an emission factor of 0.000423 t-CO₂/kWh (national average for FY2024 in the supplier emission-factor list published by Japan’s Ministry of the Environment and METI). Warehouses assume a 10% reduction in controlled equipment’s electricity use in steady operation; HVAC figures are per facility, averaging 23 units (partner data). Energy saving only; DR excluded. Environmental attributes no longer needed correspond to the electricity saved; reaching 100% renewables still requires compliant procurement for the remaining power. Scope 2 reductions assume an unchanged emission factor (GHG Protocol Scope 2 Guidance §4.3; SSBJ Climate-related Disclosures Standard, paragraphs 53–54). Results vary by calculation method and factor.
Frequently Asked Questions
How can power use fall without changing the set temperature?
We do not ask you to tolerate higher temperatures. Control maintains the same temperature band with less power by adjusting compressor frequency and staging, evening out start/stop timing and correcting temperature imbalances, based on measured outdoor and cold-room temperatures. Control operates only within the permitted band.*2
*2 Control operates only within the pre-set permitted temperature band.
Which equipment is less likely to benefit?
Equipment with no spare operating capacity, such as production-line freezers that must always run at full capacity, offers limited scope. Savings may also be smaller when equipment is stopped or in thermostat-off mode for long periods, such as during mild seasons. If significant savings are unlikely, we will explain this at the estimate stage.
How large are the results, and how are they verified?
Indicative savings are 10–20% for freezing and refrigeration and 20–40% for air conditioning. We verify results by comparing operation with control switched on and off on alternate days over a defined period. Savings do not peak immediately after installation; they increase in two stages over about a year.*1
*1 Results vary with equipment configuration, operation and outdoor temperature. These ranges are indicative, based on our track record, and are not guaranteed. The service is provided on a best-effort basis.
* “Up to 40%” is a 4-day comparison under stronger control in the same cold room (a 7-day comparison gave −32.3%). These are equipment-side measurements, not whole-site utility-meter values. Measured examples (customer names withheld): −18.7%, HVAC at a major electronics manufacturer (spring 2026, alternated with normal operation); −11.8%, refrigeration at a major food manufacturer (four measured periods regressed on outdoor temperature, annualised); −40%, a major vegetable producer’s cold room. Values are site-specific, vary with equipment and operation, and are not guaranteed.
* Temperature is controlled only within the permitted band. Cumulative electricity use and reduction rates are measured at the equipment, not at the whole-site utility meter. System diagrams and screens are illustrative.
* Indicative ranges are based on our track record and do not commit to any level of results (best-effort basis). Results vary with equipment configuration, operation and outdoor temperature.